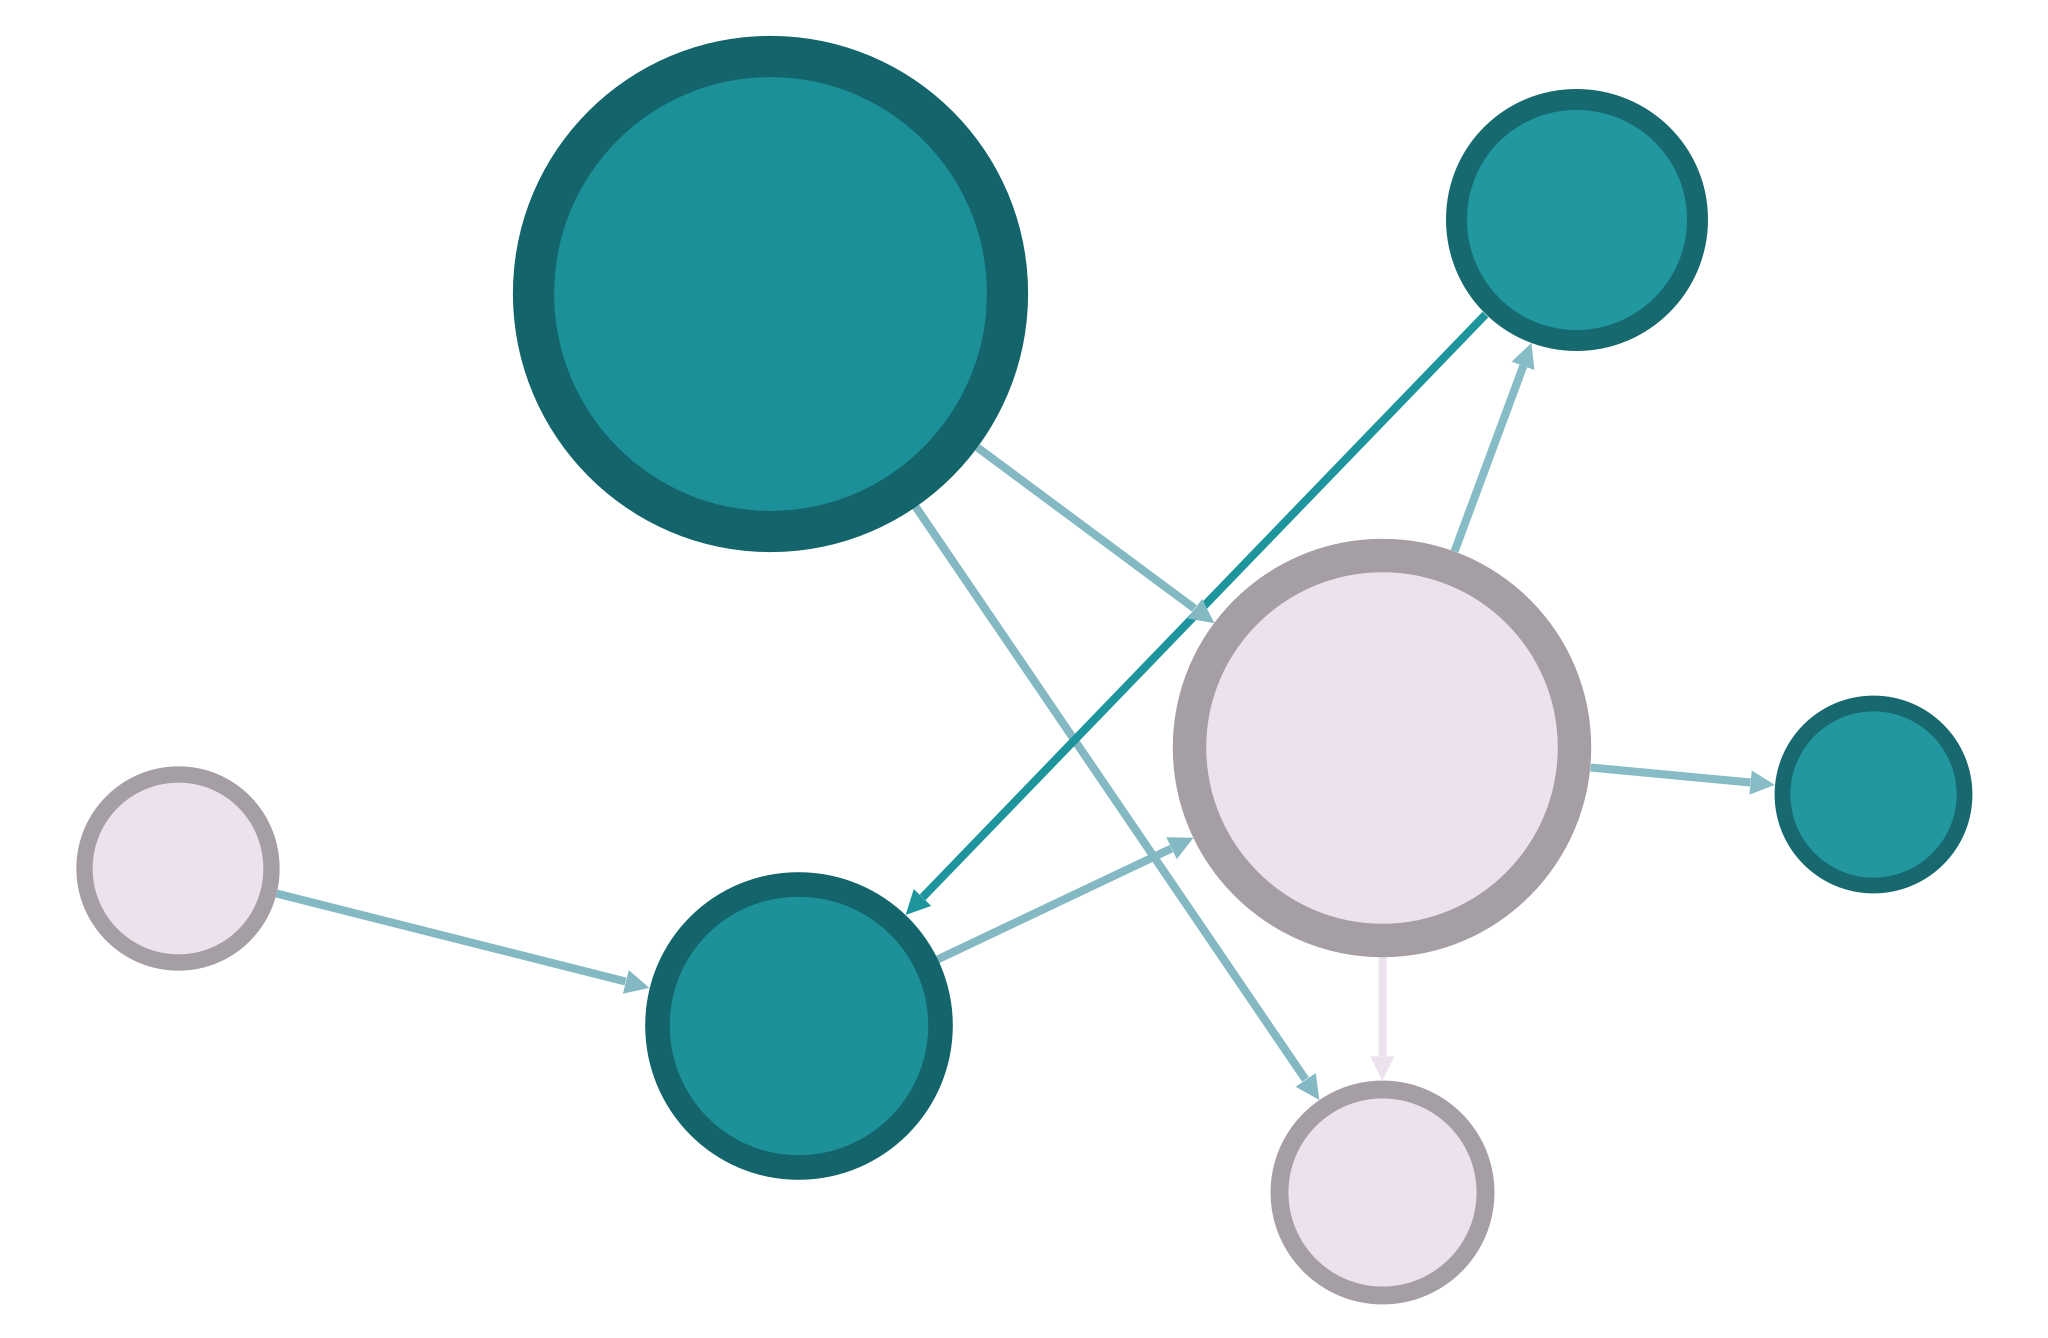
Creating a Network#
Sometimes we work with network data that was already collected and curated by others, but in humanities projects we often have to create network data ourselves. Therefore it’s necessary to understand how network data is collected, processed, and stored. You will practice creating and collecting some network data in pairs. You’ll organize the data and manipulate it using some basic network analysis software.
Here are the steps:
Choose one of the Sherlock Holmes stories in The Arthur Conan Doyle Encyclopedia and try to imagine it as a network. These pages contains lots of information about characters, places, plots, and references in every story. The bottom of every page also contains the full text of the story: you don’t necessarily need to read the whole thing, but keep in mind that there may be useful information in the text itself.
Come up with a plan for how to collect network data from the story. There are many possible ways to connect parts of this story. You might use characters as nodes, but you might also use places, objects, or even words. You could create a network of character relationships (who is in the same family/workplace/friend group?), or you could create a network of place cooccurrence (which places are mentioned together in the same scene, the same paragraph, the same conservation?), or you could create a network of people and the places they travel to. The important thing is that you choose (1) what the entities or nodes in your network will be, and (2) the principle of connection or edges that connect those entities. Whatever you choose, stick through it as you collect data.
Keep an organized record of your network as both an edge table and a node table. We discussed some different data formats, but the edge table will be the most useful for the tools we’ll work with. You should set things up so that different people can collect data into the same file. (You can use whatever application you like for this, but you might find a shared spreadsheet easiest.)
Record information about nodes as well as edges. Exactly how you organize this data is up to you, but consider collecting information on both node and edge attributes. These are additional columns in your node and edge tables that contain information about either the entities or relationships in your network.
From the data you collected, draw your network as a node-link diagram using pen and paper. Consider how you will represent the entities and connections, and where each will be placed. You’re not limited by the function of a specific piece of software here, so feel empowered to try whatever design you want.
Next use Network Navigator to visualize your network. To do this, you will need to export your spreadsheets (especially the edge table) as a plaintext CSV (comma-separated values) file; this is typically available under “Export” or “Save as” in whichever spreadsheet application you’re using. Drag-and-drop the CSV edge table into Network Navigator and add some detail to the visualization, i.e. don’t just go with the default. Change the color or styling, update the positions of the nodes, add labels, etc. When you’re finished you can export your visualization as a .png file.
Share what you did with the other groups. It’s likely you’ll have made different choices in defining nodes and edges, recording your data, and visualizing your network. Take some time to observe these differences and think about how this series of choices might apply to your own research.
Start work on your own projects. If you don’t yet have network data, what would it take to transform your current research materials into the edge- and node-table format? If you already have a dataset, is it in a form that’s usable with a tool like Network Navigator? If so, you might start visualizing it, and if not you might consider some different methods of converting the data. If you’re looking for some data to experiment with, I recommend starting with Melanie Walsh’s sample network datasets.
