This is the text of my portion of a talk for the Association for Computers and the Humanities conference, co-presented with Matt Lavin on 25 April 2019. This post includes just the introduction and my portion of the presentation. You can find Matt’s portion of the talk in this post.
This is a work in progress, so please do not cite or circulate.
In his foundational 1973 essay, “The Strength of Weak Ties,” Mark Granovetter helped to launch modern social network analysis by advocating for the ability of networks to act as a “micro/macro bridge,” a medium-scale approach that shows how small-scale occurences aggregate into large-scale phenomena. Lately I’ve become captivated by how fresh his argument still seems. Our colleagues have so far presented today on just a few of the many ways network analysis, or graph theory, can add to literary and historical knowledge by exploring medium-scale phenomena. Beginning with the first humanities network visualization projects and expanding into increased use of graph theory principles and metrics, humanities networks projects have grown up alongside the digital humanities. Though “micro” close reading approaches and “macro” statistical studies have seemed to form opposing poles of analysis, network theory has developed a strong descriptive vocabulary for medium-scale social, historical, and literary phenomena.
We now understand networks, as Granovetter did, not only as a visual aid for relational thinking but as a set of mathematical measures that can give us greater purchase on large and small questions in our field. In fact, as we will argue in today’s presentation, we have methods at our disposal today that can be combined with network metrics to great effect.
I speak of the set of statistical techniques often grouped under the umbrella of “machine learning.” In literary studies, statistical modeling—including both unsupervised clustering methods and supervised classification tasks—has most often meant processing and modeling data pertaining to words and wordcounts, but there is no reason that these same techniques can’t be applied to network metrics instead. That is to say, networks give us a great deal of measurements, and these measurements can be aggregated to allow us to sort texts in new ways.
The core of our approach is simple: network metrics can be used to create a vector, or what Ruth and Sebastian Ahnert have called a fingerprint, for an individual network or even an individual node. By calculating over all of those vectors at once, networks can be sorted into various groups. And let’s be clear: just as with modeling the words within literary texts, we learn more from the process of modeling than from the output of the model. We engage in this process to get a better sense of the set of features we’re examining, and in this case those features tell us more about networks and the systems those networks describe.
Drama Networks
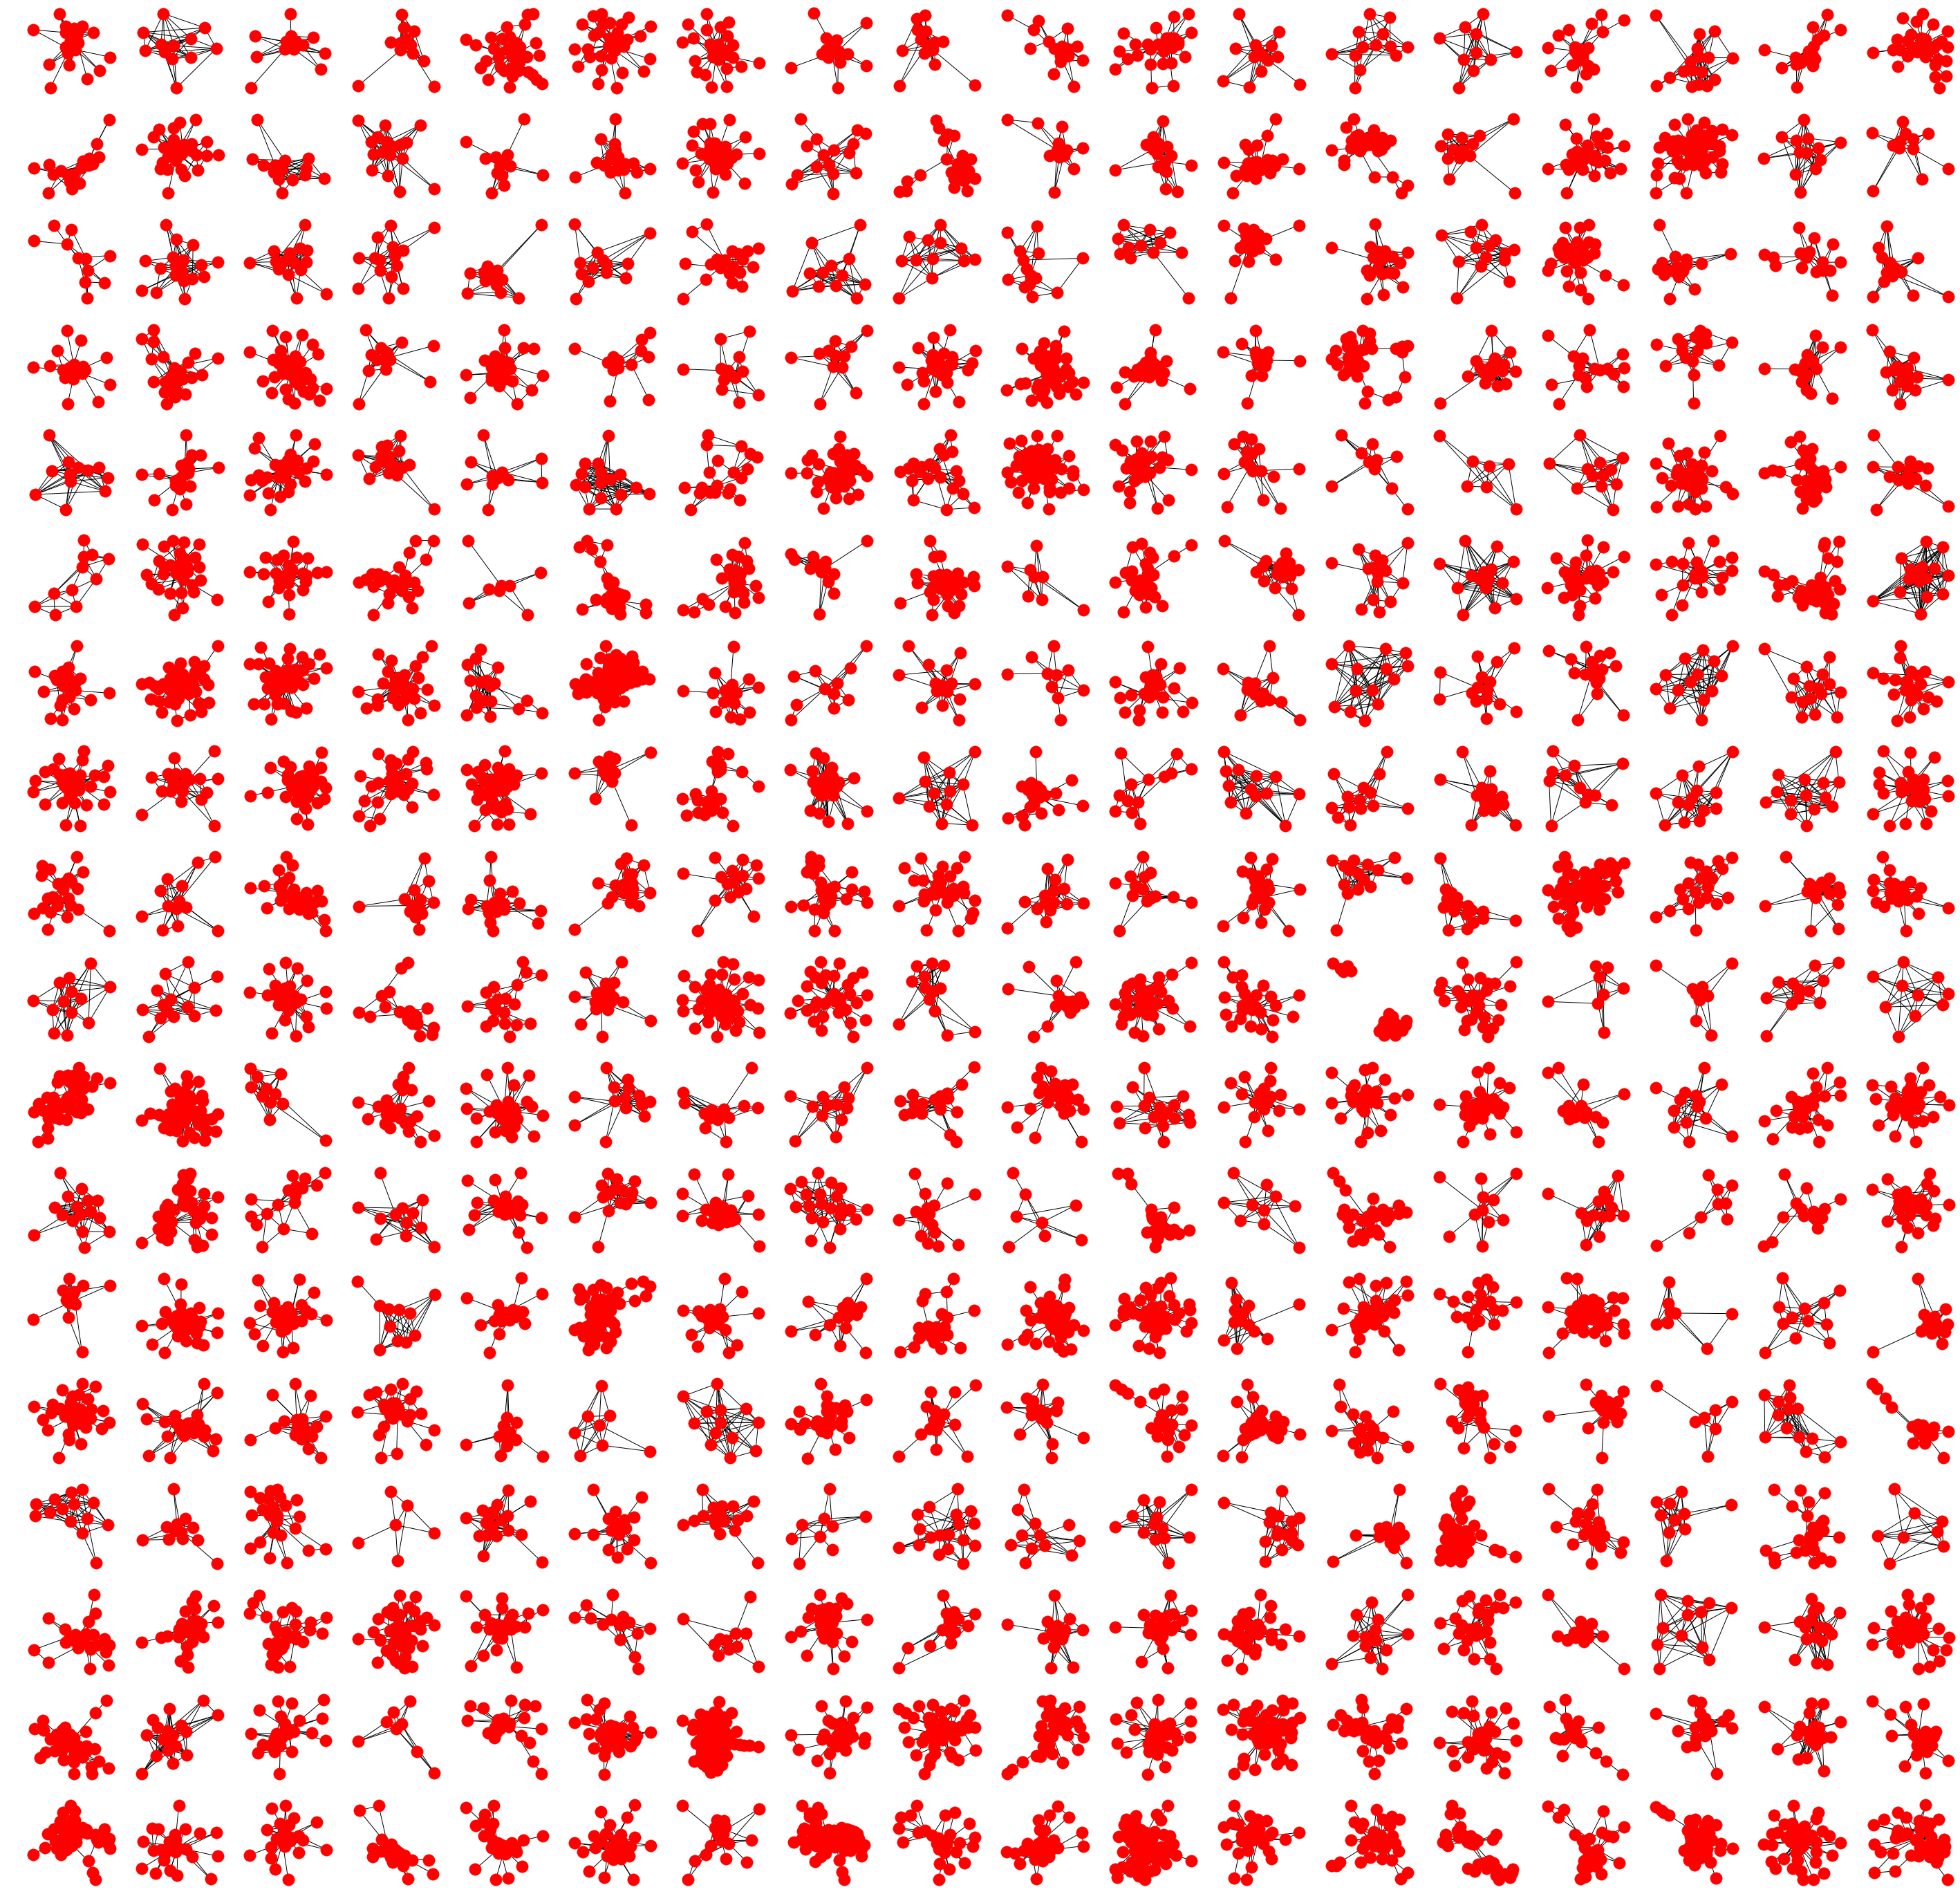
A sample of the drama networks generated for this project.
Our primary purpose in this short presentation today is methodological: we aim to show that clustering and classification of network features is an effective method for networks across a variety of historical periods and literary genres. Therefore rather than a single large project, we present today two smaller investigations that highlight the promise of these methods and leave open directions for future research.
My work-in-progress deals with a dataset that consists of many small networks rather than one large one: networks of playtexts taken from the Folger Shakespeare Library’s Anthology of Early Modern English Drama and supplemented with the Folger Digital Texts Shakespeare corpus. Early modern studies has been the site of exciting recent work on network metrics. I already mentioned Ruth and Sebastian Ahnert, whose most recent article analyzes similarity among nodes in a single large network of early modern correspondence. Our approach is an extension of theirs, using network metrics not only as the basis for distance measures but as the input for machine learning. And Mark Algee-Hewitt’s recent study, “Distributed Character,” aggregates node-level metrics like eigenvector and betweenness centrality to characterize a network as a whole. We build on this approach by using network-wide metrics such as density and diameter, which are designed to describe overall network structure.
My dataset was made up of 332 networks, created by extracting dialogue headings from the XML markup for most of the plays written and performed from 1576 until the closing of the London theatres in 1642. The nodes are the play’s characters and the edges are the amount of dialogue shared between two characters. The ways we build networks change what our data can represent. A network based on character interaction—who speaks to whom—is very different from a network based on character relationships—familial, business, and social connections. I hope today to subject this specific set of network features to common statistical standards of predictiveness, to investigate the ways character interaction effects plot shape and genre category.
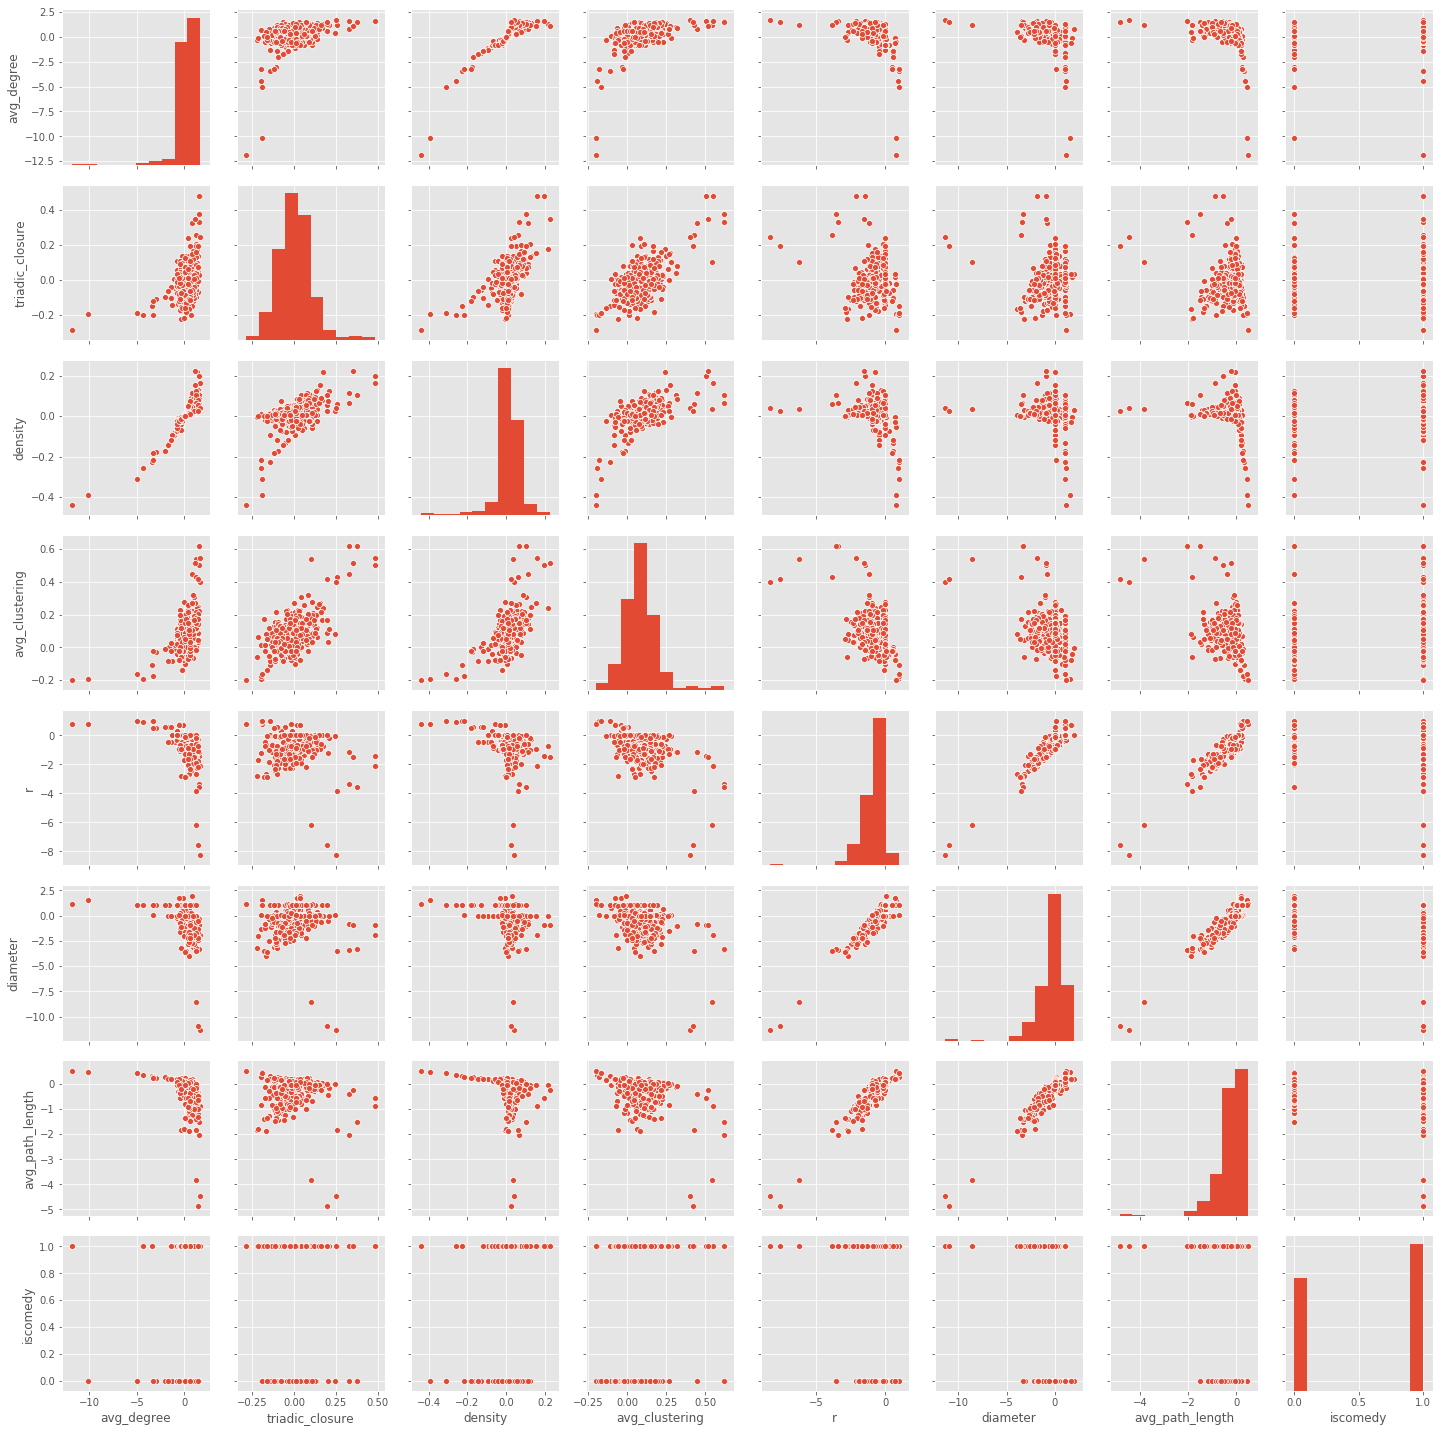
Pairwise scatterplots showing relations among each feature.
Each play-network was measured for its density, radius, diameter, triadic closure, and average path length, as well as the average degree and average clustering coefficient of all its nodes. Networks cannot be directly compared: even slightly different numbers of nodes might greatly throw off the scale of measurements. To solve this issue, all measures were expressed as the difference between the measure and the average measure from a set of random networks of identical size. We can learn a lot about these networks just by graphing and comparing these metrics, including how the individual plays are distributed when graphing them by paired features as well as how the various features correlate with one another.
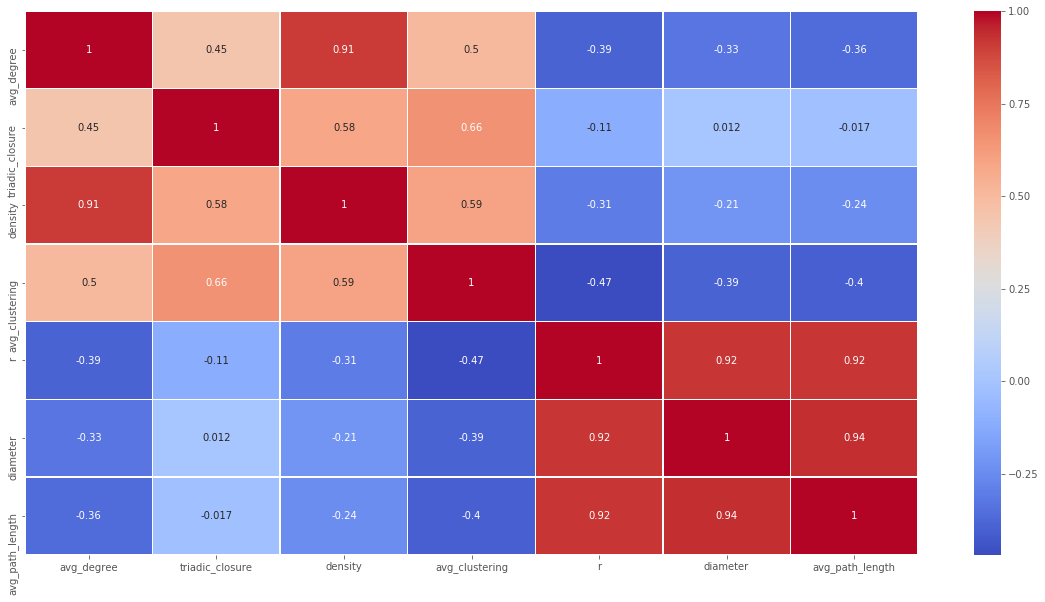
Correlation heatmap of all features. Note that features based on node degree (density, avg_clustering) are correlated, as are features based on path lengths (diameter, radius).
With this featureset prepared, I ran k-means clustering, an unsupervised clustering method that splits observations into a predetermined number of groups. You can see those groups graphed here. While the unsupervised method didn’t separate all plays by genre as cleanly as I would have liked, certain clusters tended to include more comedies while others had more tragedies and histories. This was an early indication that it might be possible to use these features to predict genre.
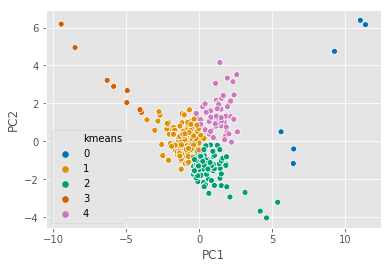
PCA graph of K-means clustering results.
I mentioned a moment ago that the main benefit of this method isn’t the classification itself. The best way to determine the genre of a play is by reading it, and this is a small enough dataset that reading all the plays is indeed possible. Simple interpretable machine learning methods allow us to explore the relationship between a statistical feature, in this case a network metric, and the object of study. In this and other projects, I am primarily interested in the relation of network metrics to literary form: what is a measure like the density of a play’s dialogue network telling us about that play?
For this purpose I turned to a common and relatively straightforward method, logistic regression, often grouped under machine learning but itself an old and well-established statistical technique. One of logistic regression’s chief advantages is the coefficients it provides for each feature, which reveal how predictive a particular feature was—how much it drove the model’s classification decision. Logistic regression is a binary classifier, meaning that it can only sort into two categories at a time. Because logistic regression relies on categorical data it is well-suited to genre categories, and it is the same technique used by Ted Underwood in his article “The Lifecycle of Genres.” I labeled each play as either a comedy or not, since many histories and tragedies share attributes. I fit a logistic regression model to those categories, and I was able to determine that high density is predictive of comedy, while high diameter and average path length likely indicates that a play is not a comedy.
This comports with things we already know about early modern comedy: that they include multiple subplots and characters who move between them, which would create higher density, and that within those subplots character interaction is tightknit, which creates lower average path lengths between charcters. Just to be clear: I don’t think this study is close to making a firm claim about the relation of these specific metrics to dramatic form, but it may be in the future. For now the key is that we can categorize plays by genre, with considerable success, without recourse to the language of the plays at all. This approach takes only the shape of dialogue and character interaction into consideration and shows that a play’s genre can be reasonably predicted these medium-scale features.
There’s more work still to do. You can see here the proportions of false positives and false negatives the model produces in its confusion matrix. Some of the model’s confusion is likely due to the fact that the genre signal is intertwined with the time signal in the corpus.
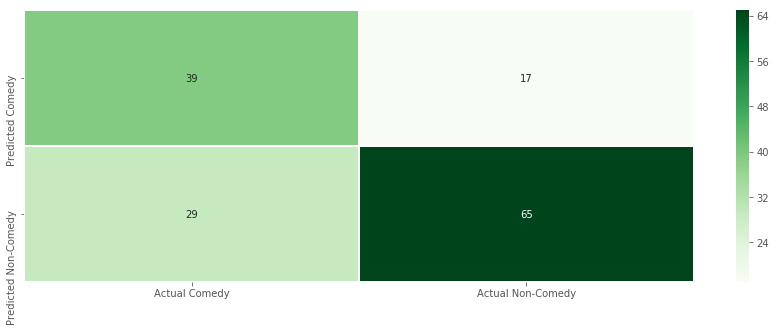
Confusion matrix from logistic regression results.
I hope to do more work that may separate out genre signal from time signal, but I don’t expect network metrics to ever cleanly correspond to just one vector of dramatic categorization. Instead, these categories are likely aggregates of authorship, date of composition, genre, and other effects. As I continue to advance my work on the relation of networks to various literary forms, these early results are a promising indication that applying machine learning techniques to network data can give us purchase on big questions of relationships among literary texts.