R Basics
DA 101, Dr. Ladd
Week 2
A Pirate’s Favorite Programming Language
What’s the Difference Between R and RStudio?
R is a programming language.
It’s the code you write.
somedata <- read.csv("yourfile.csv")
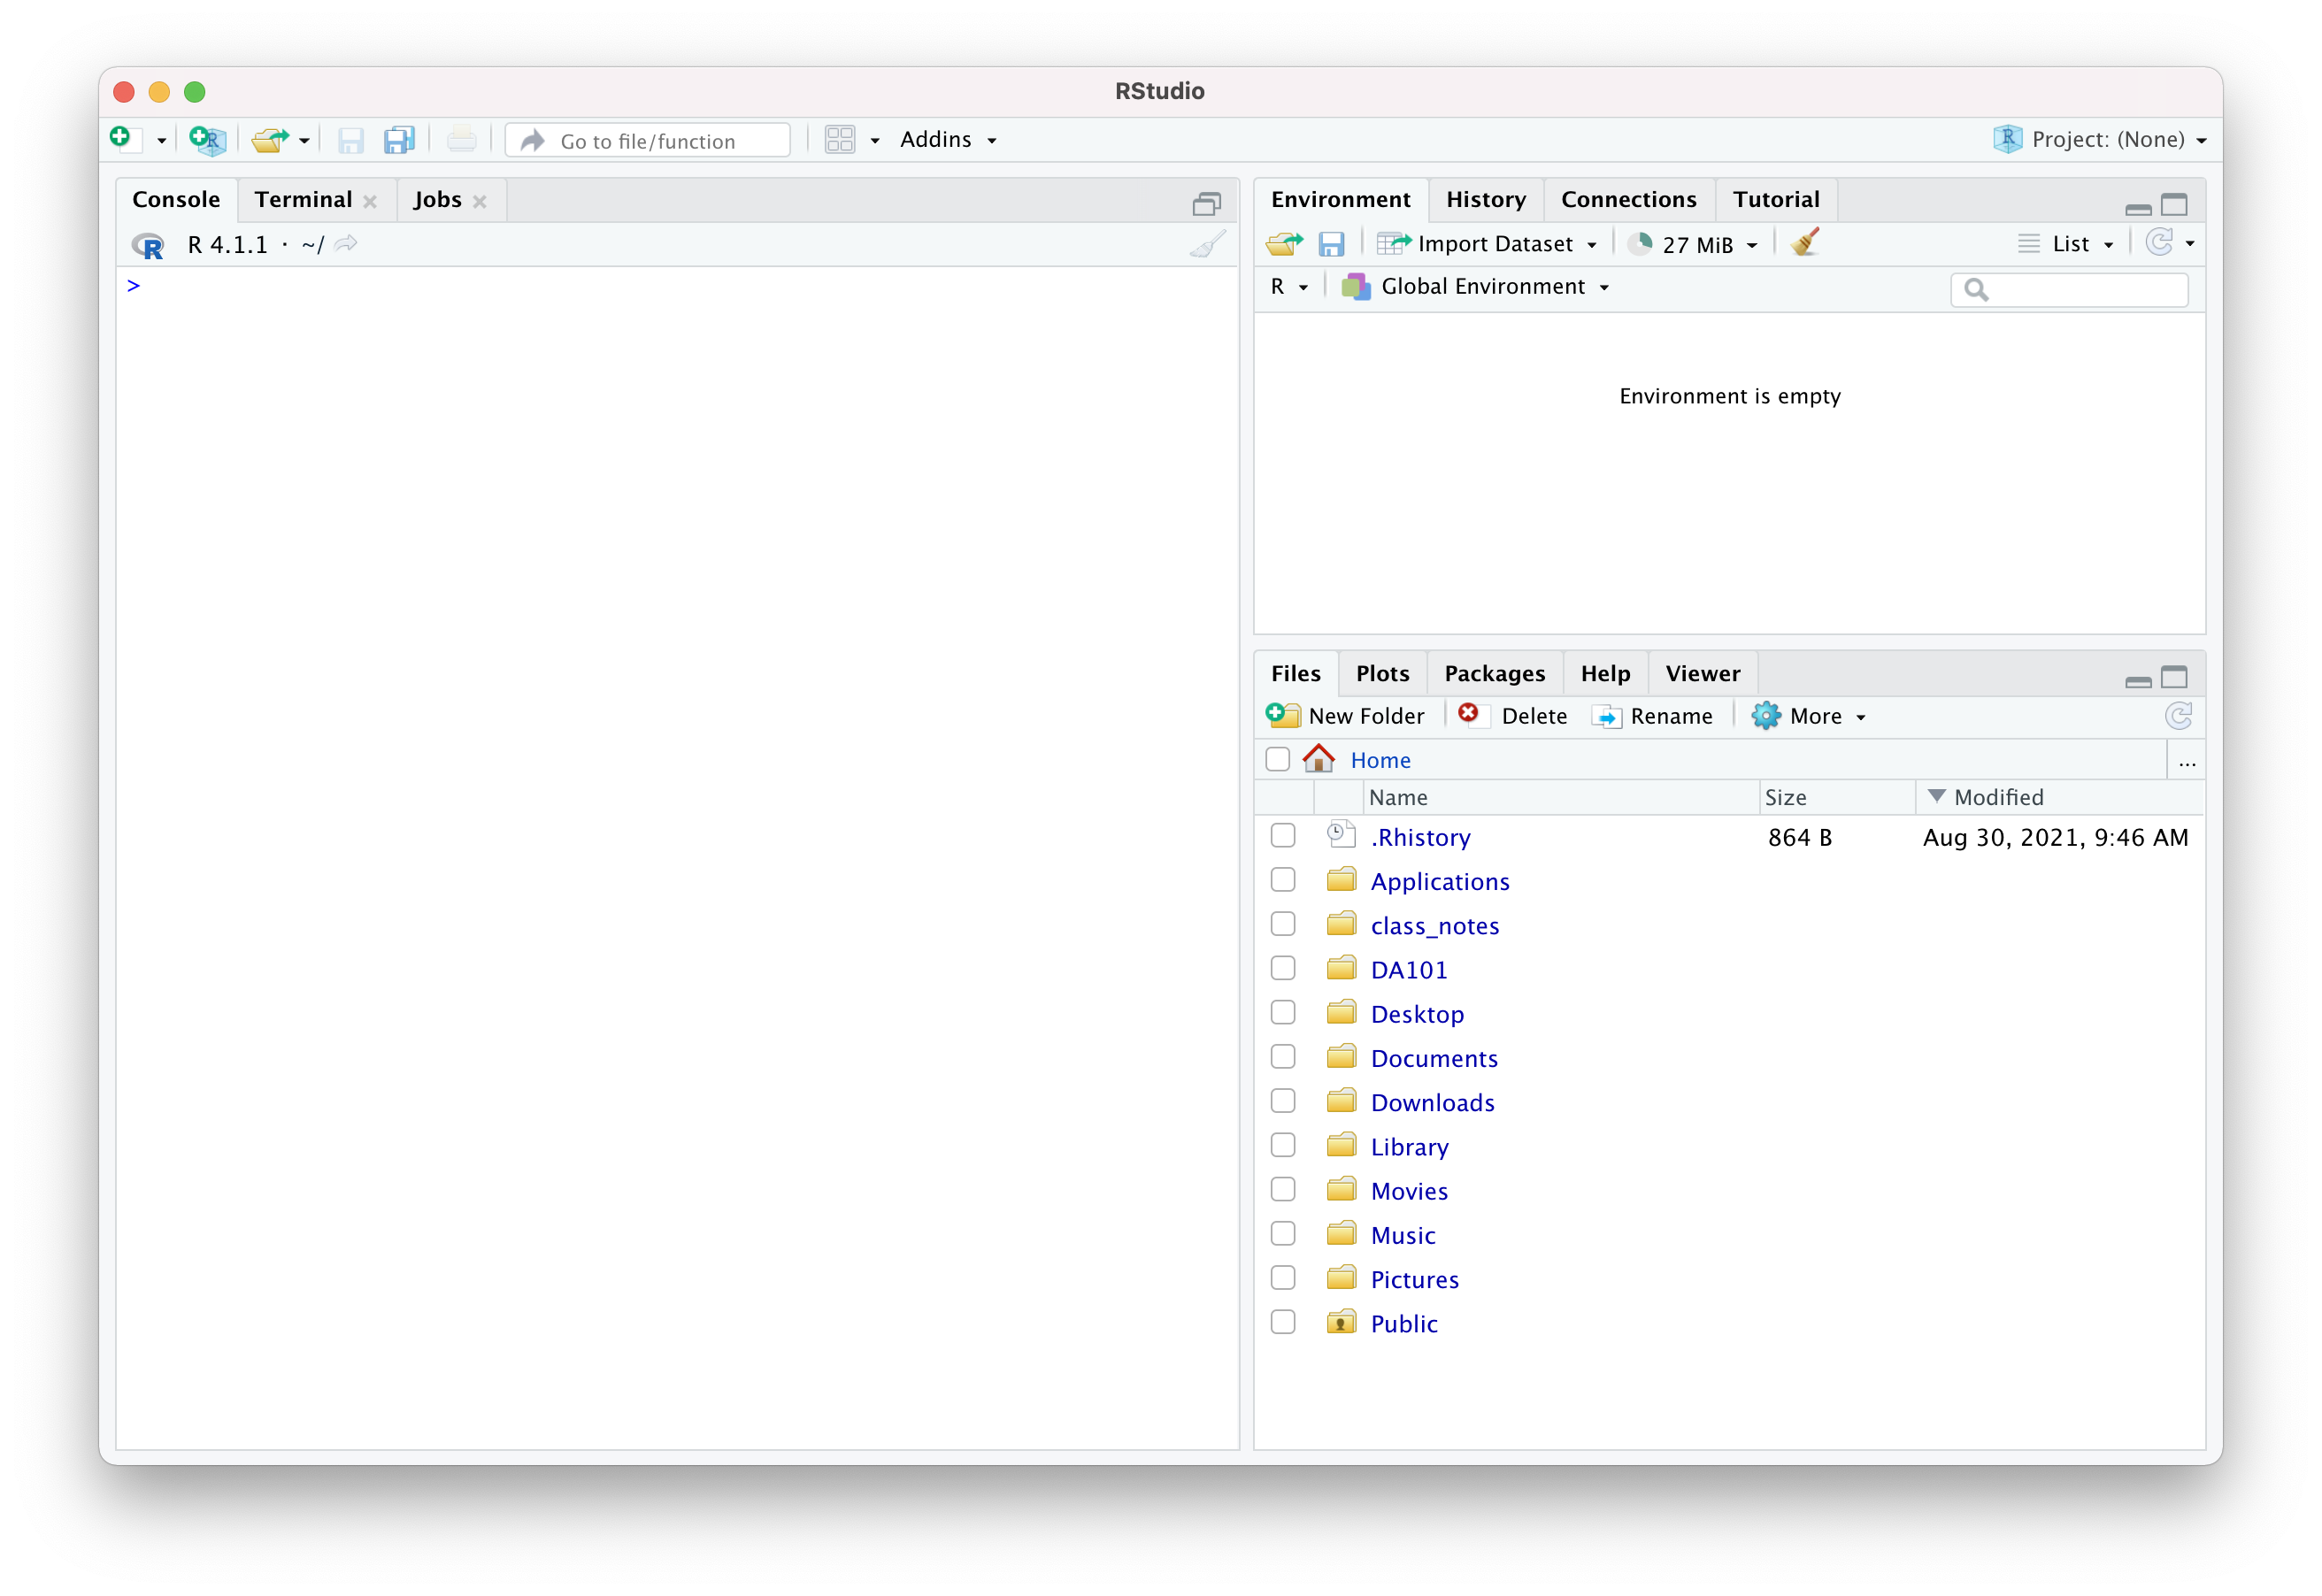
RStudio is a desktop program.
When you “Open R”, you’re really opening RStudio.

Almost all RStudio commands have equivalent R functions.
You set the Working Directory to tell R which folder/directory to use on your computer. You can:
- Navigate to the desired folder in the Files section, then click “More > Set as Working Directory” or
- Type
setwd('path/to/working_directory')
into the console or a .r file.
R has its own syntax.
Variables store information
myvar <- 5

myvar
You Try It!
Create a variable called “newVar” that is equal to the value of five plus seven. Then display your variable to see what its value is.
Use descriptive variable names, and avoid spaces.
i_use_snake_case
otherPeopleUseCamelCase
some.people.use.periods
And_aFew.People_RENOUNCEconvention
Add frequent comments to explain what your code does.
Comments in R begin with a # symbol.
# This variable contains a continuous value
some_variable <- 2.5
Variables have types.
- String or Character: a piece of text (ex.
"five") - Integer: a discrete numerical value (ex.
5) - Float or Double: a continuous numerical value (ex.
5.0)
stringvar <- "five"

typeof(stringvar)
You can put reusable code in R scripts.
These are “.r” files, and you can create them by clicking the + icon at the top left of the RStudio window and selecting “R Script”.
Always comment your code so you can remember things when you come back later!
Data Frames store rectangular data.
Usually we create a data frame by reading a csv.
GarlicMustardData <- read.csv("GarlicMustardData.csv")There are standard functions and syntax for working with data frames.
# Browse a data frame with the view function.
View(GarlicMustardData)

# Get summary statistics for every column in a data frame.
summary(GarlicMustardData)

# Access a specific column of a data frame.
GarlicMustardData$AvgAdultHeight
You Try It!
Import the “GarlicMustardData.csv” file. Get a summary for all of the data, and then get a summary for just the AvgNLeaves column. Bonus: find the type of that column.
n.b. Remember to make sure your working directory is set to the right place!
Functions and Libraries store reusable code.
A function is a command that runs based on some input or parameter.
R has many built-in functions.
# Some functions give a number result
mean(GarlicMustardData$AvgNFruits, na.rm=TRUE)

# Other functions graph things
plot(GarlicMustardData$AvgAdultHeight,GarlicMustardData$bio12)
Functions can do just about anything: calculate values, create graphs, transform data, etc.
You can create functions like you create variables.
myfunction <- function(arg1, arg2, ... ){
statements
return(object)
}
A real example:
get_last_value <- function(some_list){
  return(some_list[length(some_list)])
}
Libraries/Packages contain reusable functions made by someone else.
# Install libraries only once
install.packages("packagename")

# Load a library every time you run your code
library(packagename)
You Try It!
Install and load the tidyverse package. Then install and load the swirl package. Can you tell what these two packages do?
Now you’re ready to try some things on your own!
In-Class Exercise
- Create a new .R file
- Install and import the ggplot2 library
- Make sure to add comments as you go!
- Find the
mpgdataset, view it, and get a summary - Select a column from
mpgand get its mean and median - Create a basic scatterplot of two
mpgvariables (columns)