Network Analysis
Week 12
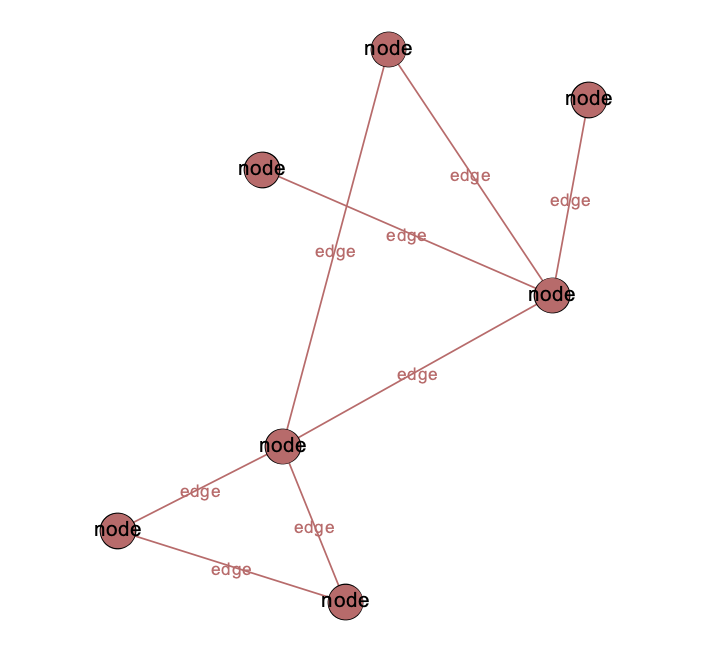
Networks are made up of…
- Entities (entity = node/vertex/actor)
- Relationships (relationship = edge/link/tie)
- We’ll use “nodes” and “edges”
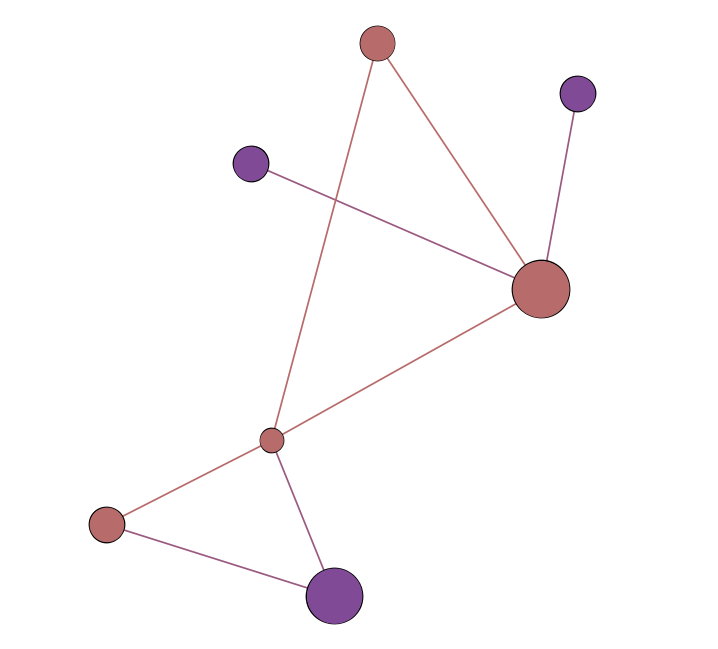
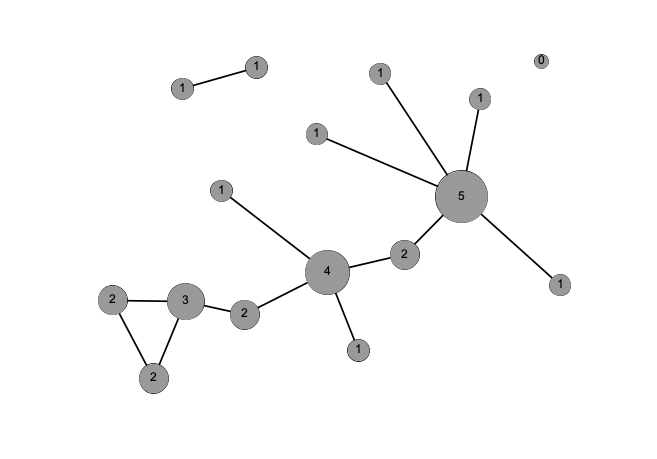
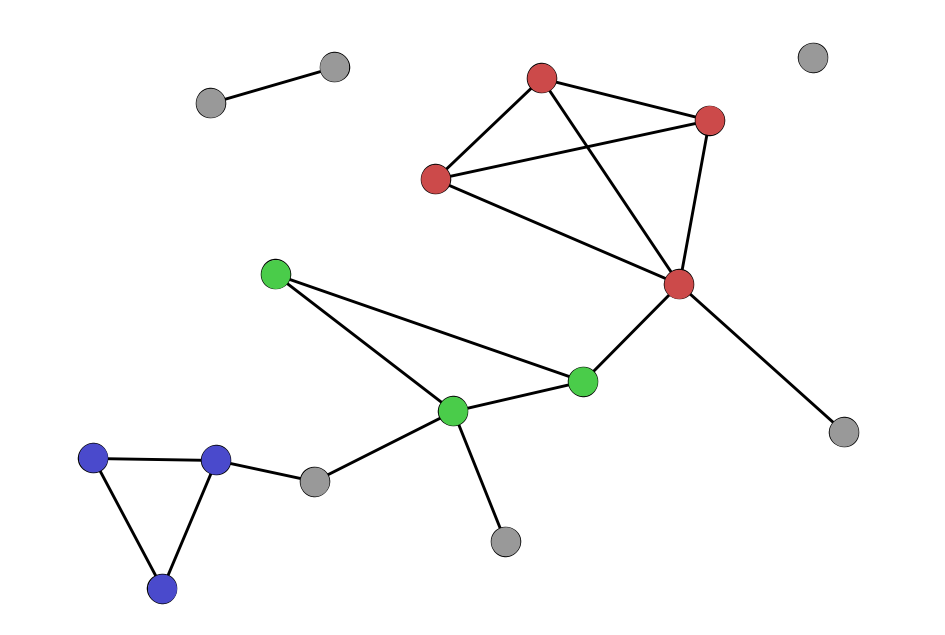
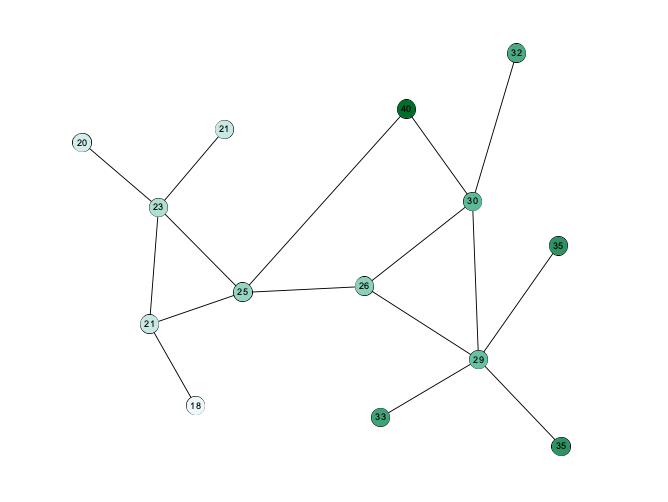
Node Attributes
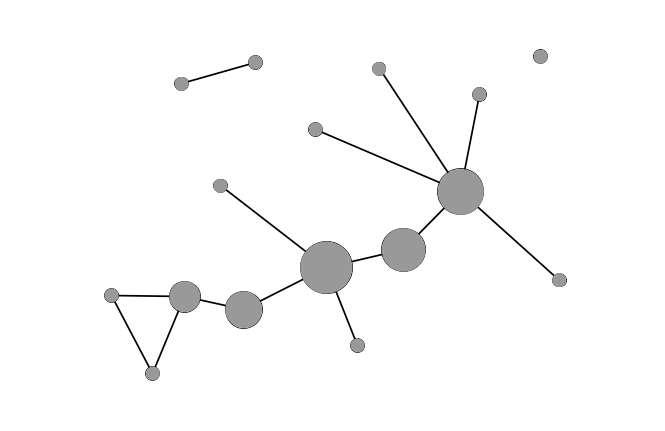
- numerical (size)
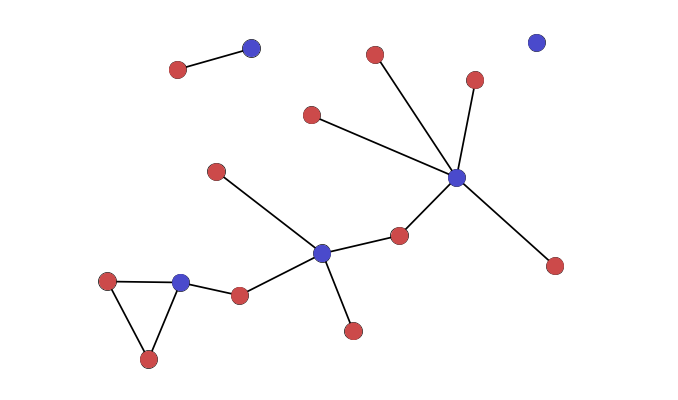
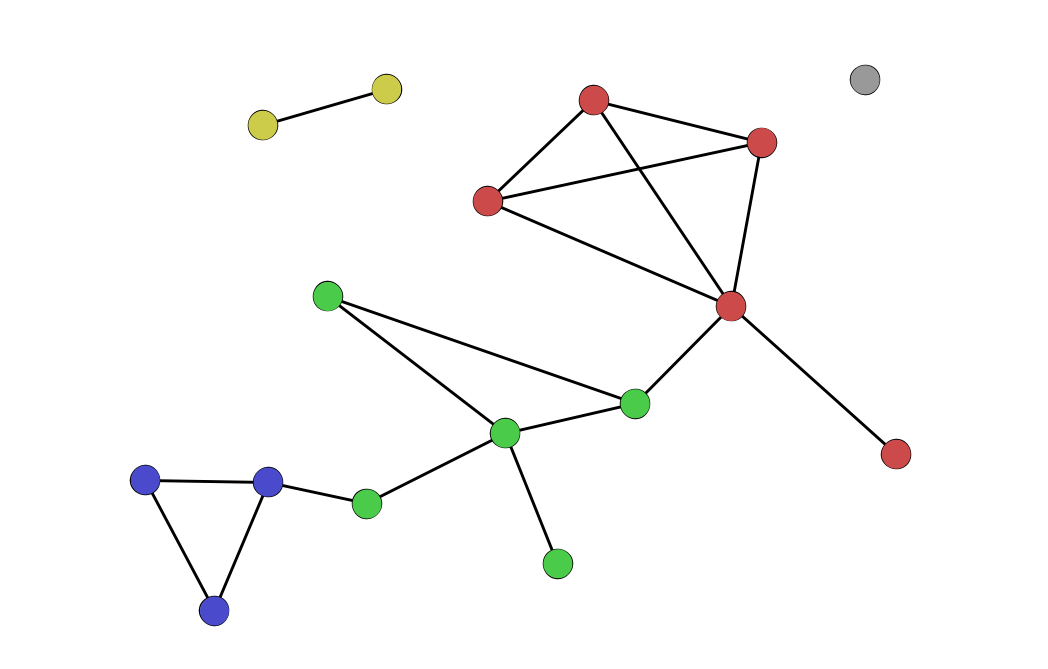
- categorical (color)
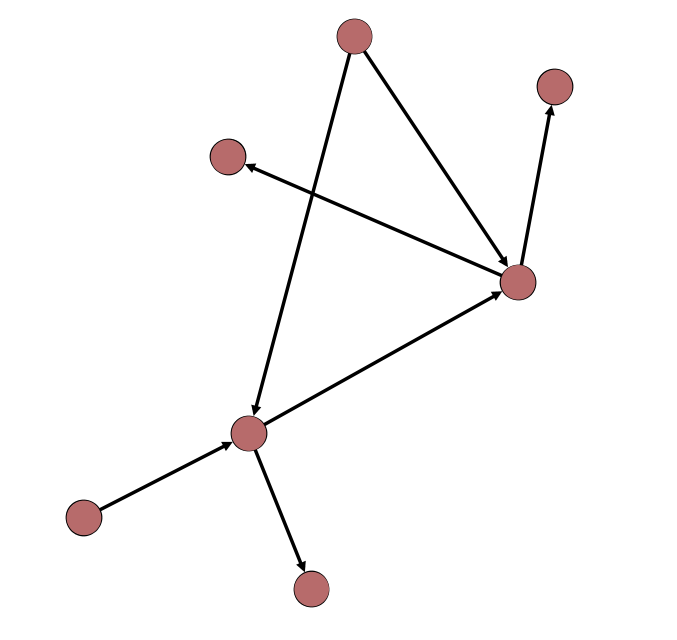
Directed and Undirected Edges
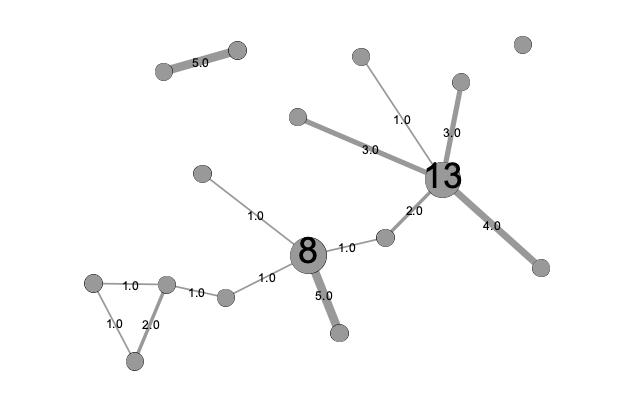
Weighted and Unweighted Edges
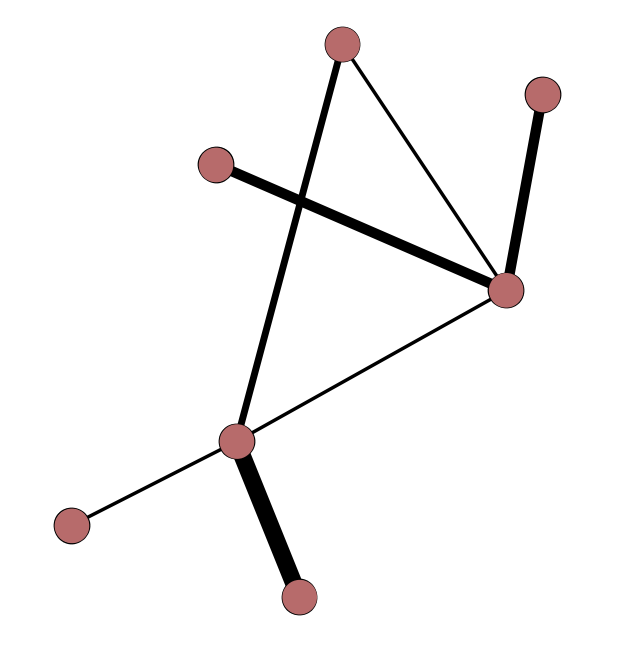
Edge Types
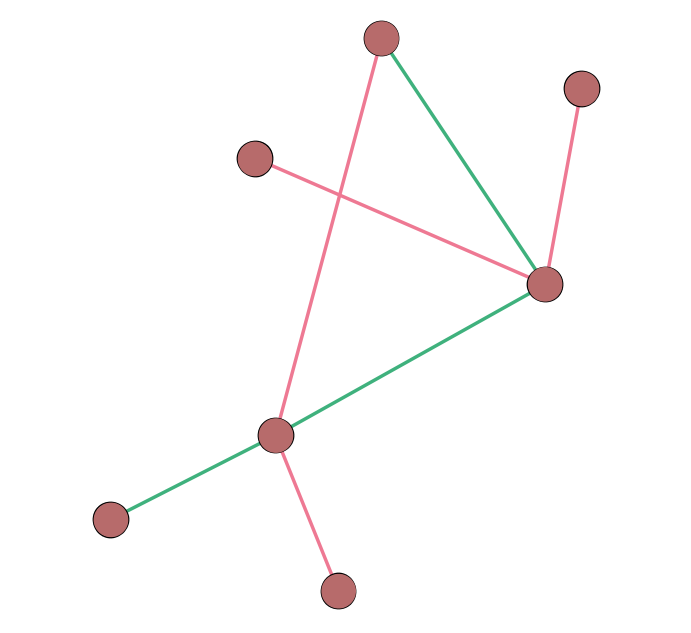
Path & Diameter
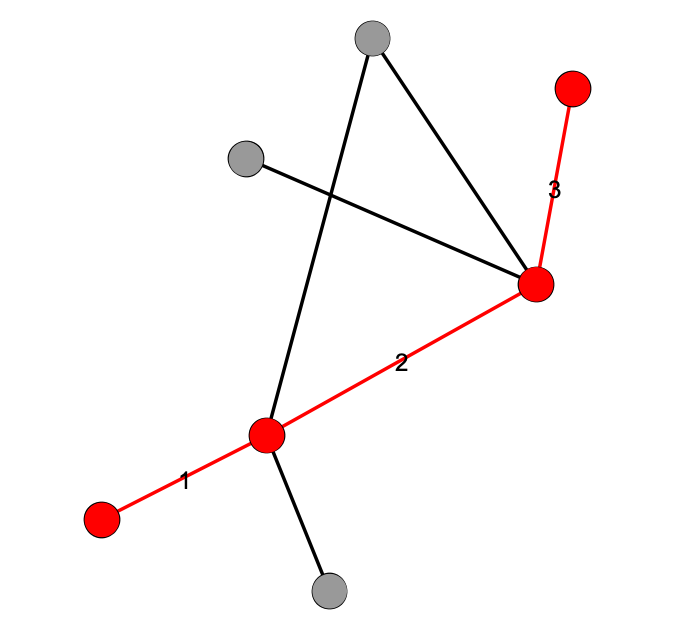
(& Average Shortest Path Length)
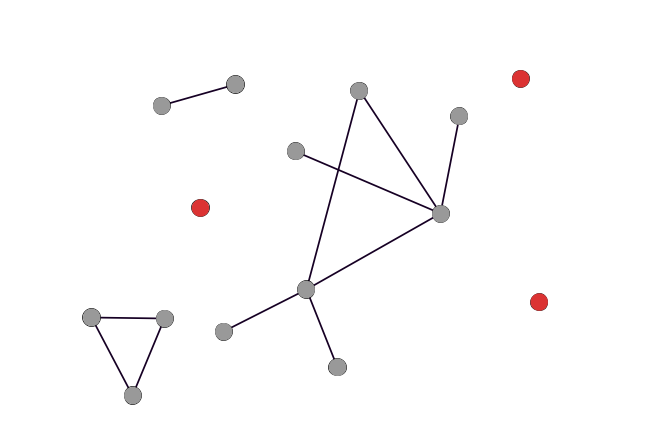
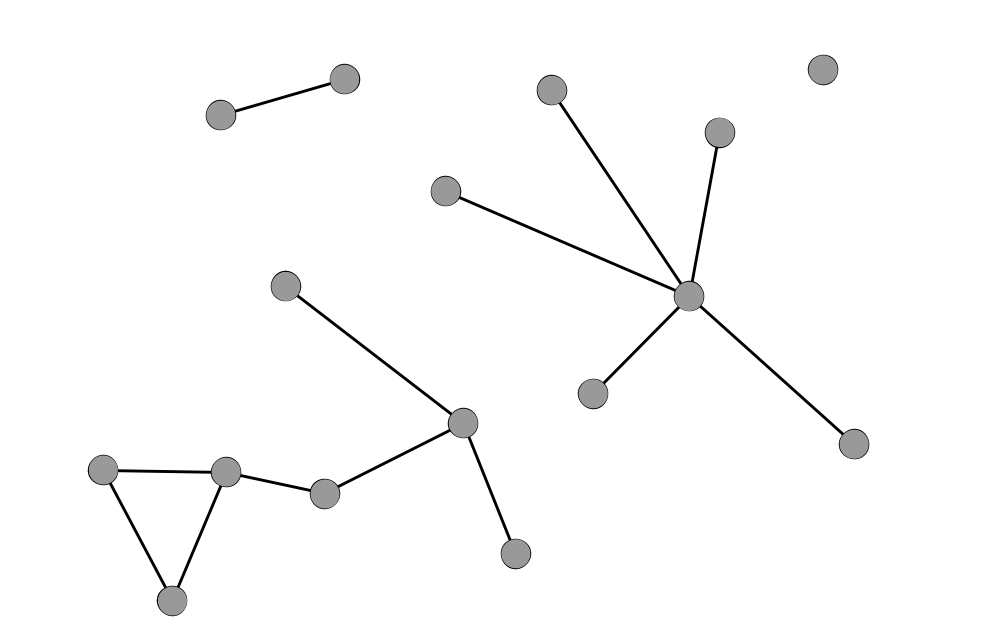
Isolates
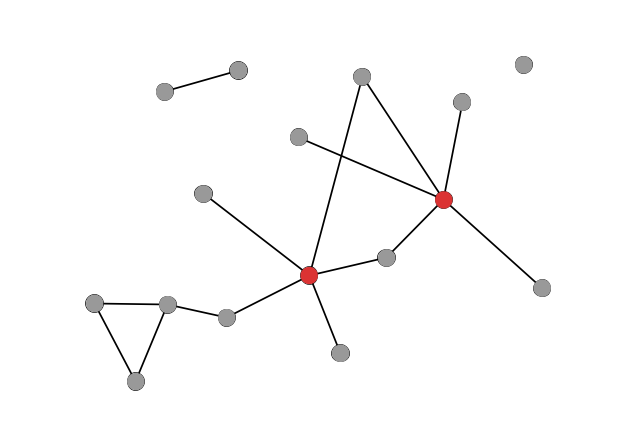
Hubs
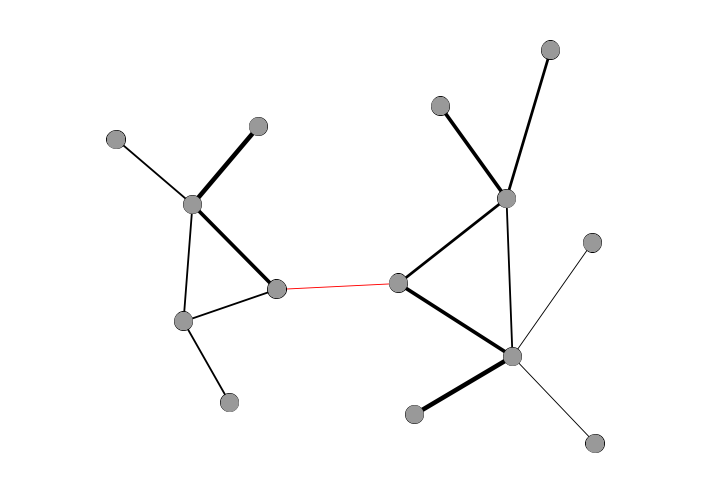
Bridges

Degree
Strength
Betweenness
Unipartite/unimodal
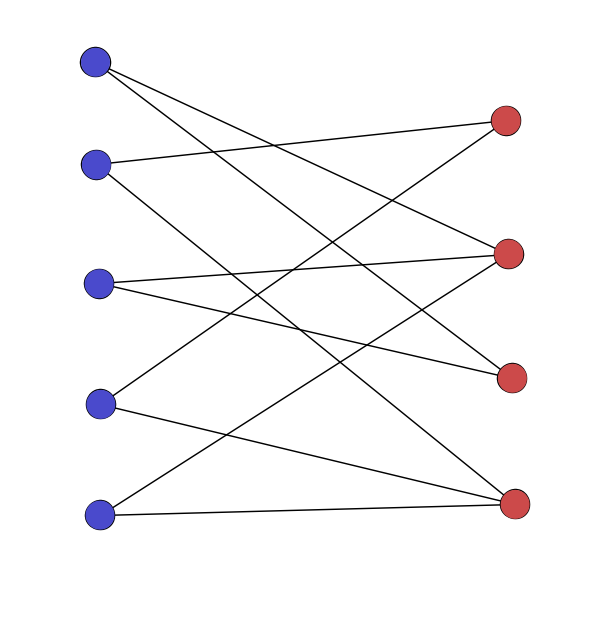
Bipartite/bimodal
Bipartite (cont.)
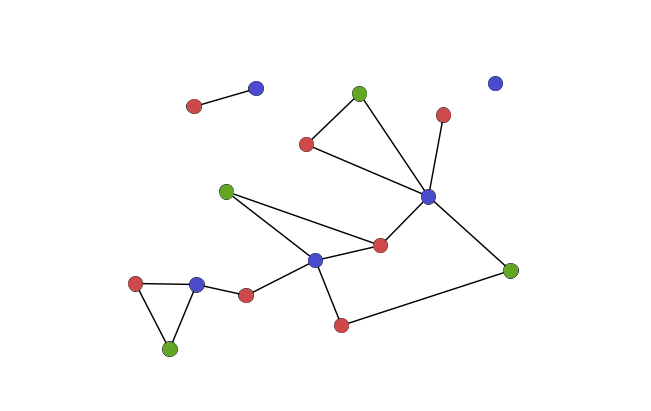
Multipartite/k-partite/multimodal
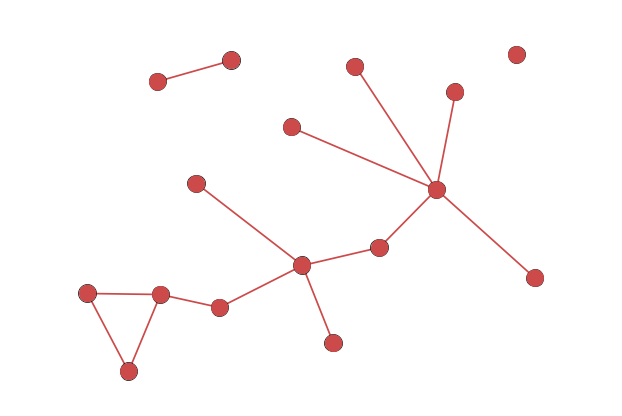
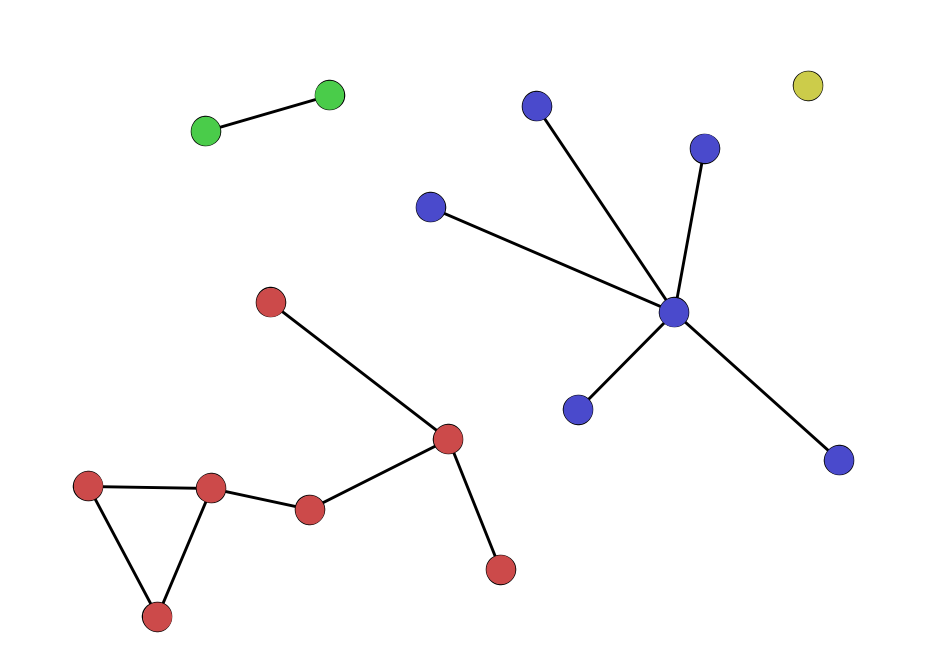
Connected components
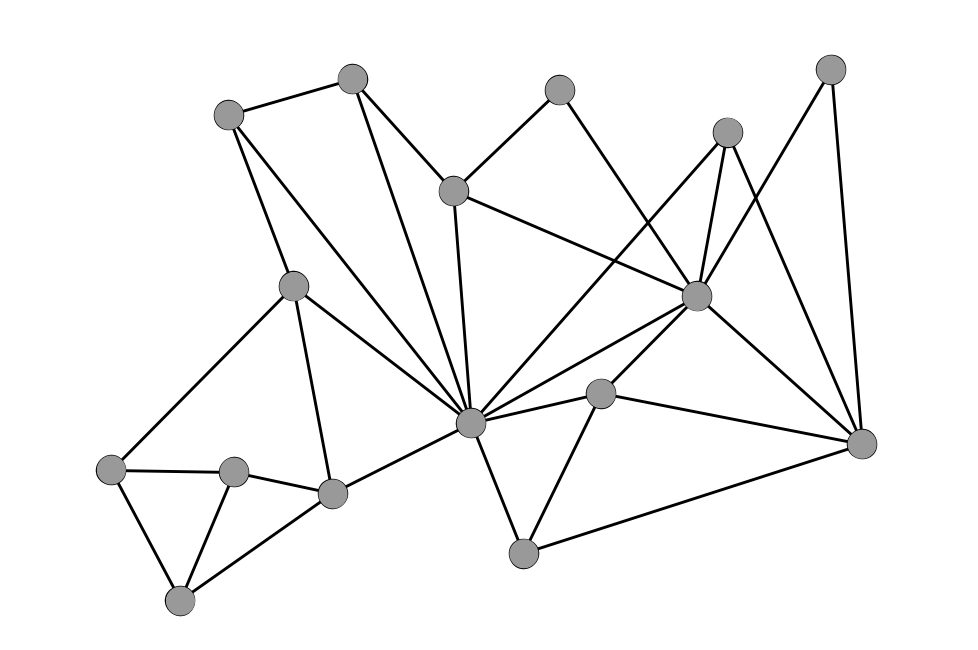
Cliques and clustering
Clustering Coefficient

Communities and community detection
A Sparse Network
A Dense Network
Adjacency Matrix

Adjacency List
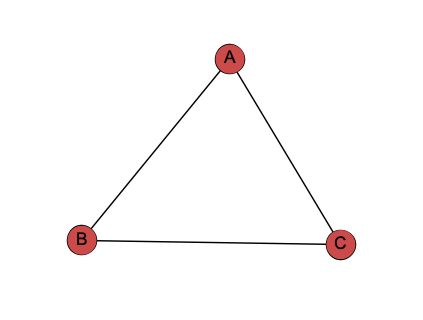
- A adjacent to B,C
- B adjacent to A,C
- C adjacent to A,B
Node-Link Diagram
Triadic Closure

Assortative mixing/Homophily
Preferential Attachment
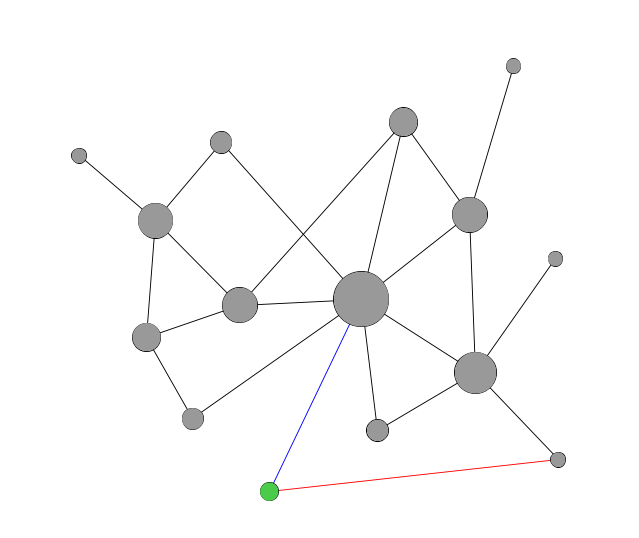
Weak Ties
Small World Network

- low average path length
- low clustering coefficients
- degree distribution follows power law (a few large hubs)
- low diameter (usually around “six degrees”)
Let’s start with an example.